Elvermont
Analyses

Representative analyses

Each example below was produced by Elvermont's standard processing chain from archive satellite imagery: seasonally matched multi-capture composites, per-pixel spectral indices, a pre-registered change rule and analyst review. They illustrate the method across different site types. They are not client work, and locations are described at regional level only.

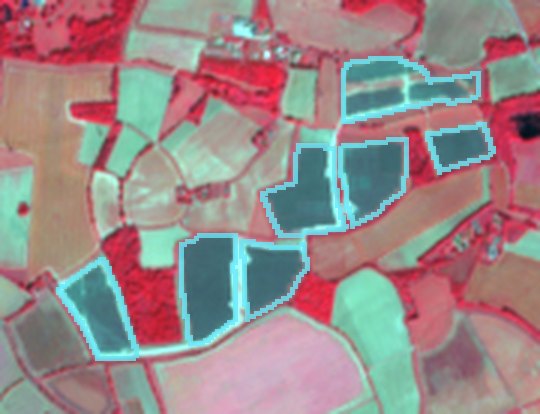
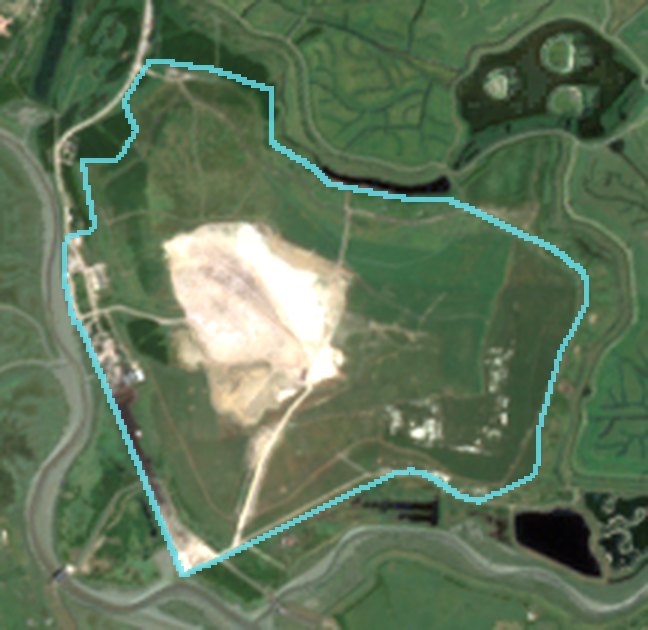
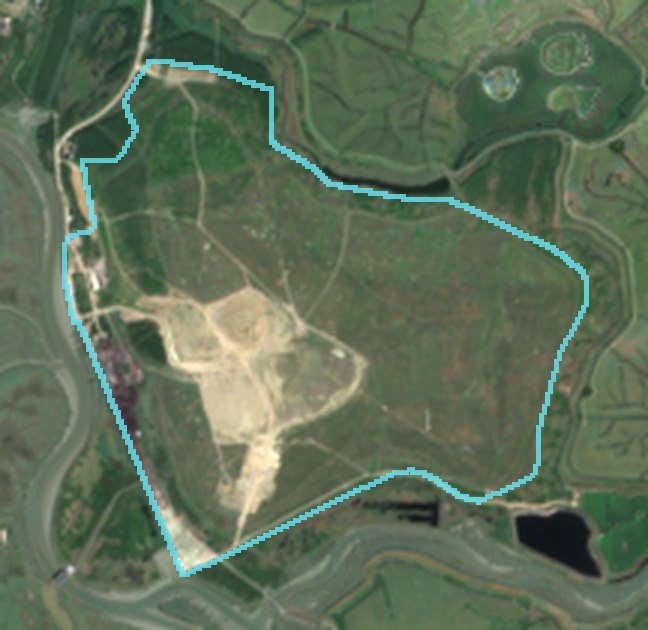
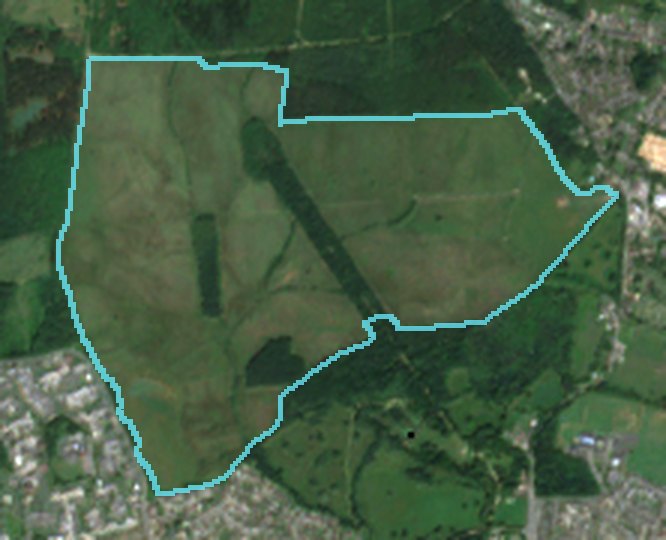
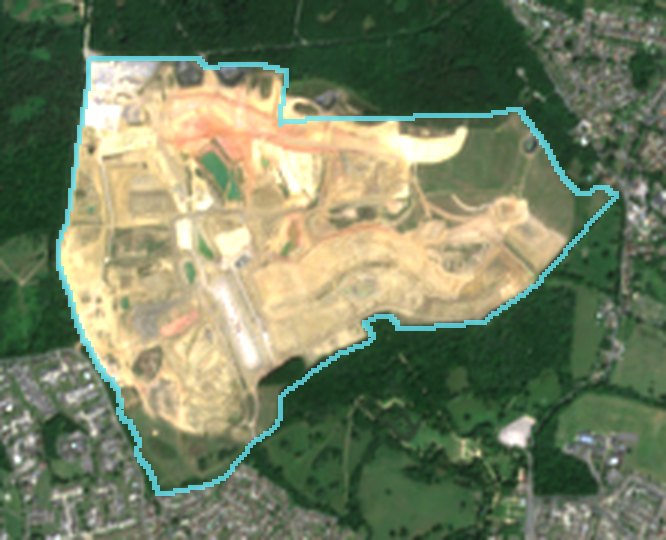
Natural colour

Red, green and blue reflectance — what the eye would see from orbit.

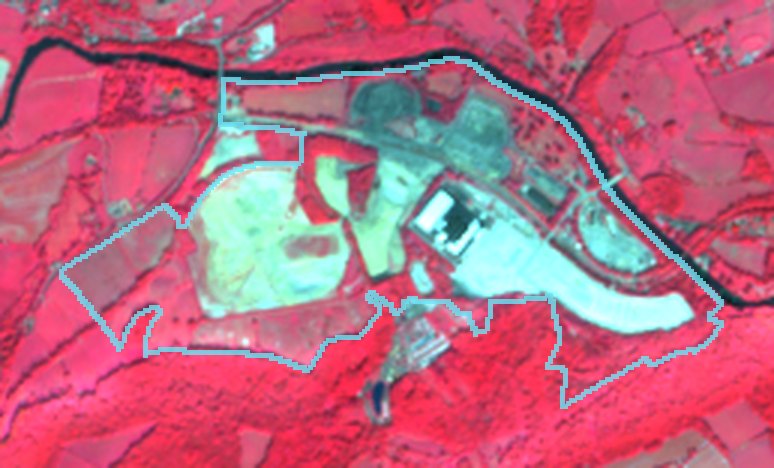
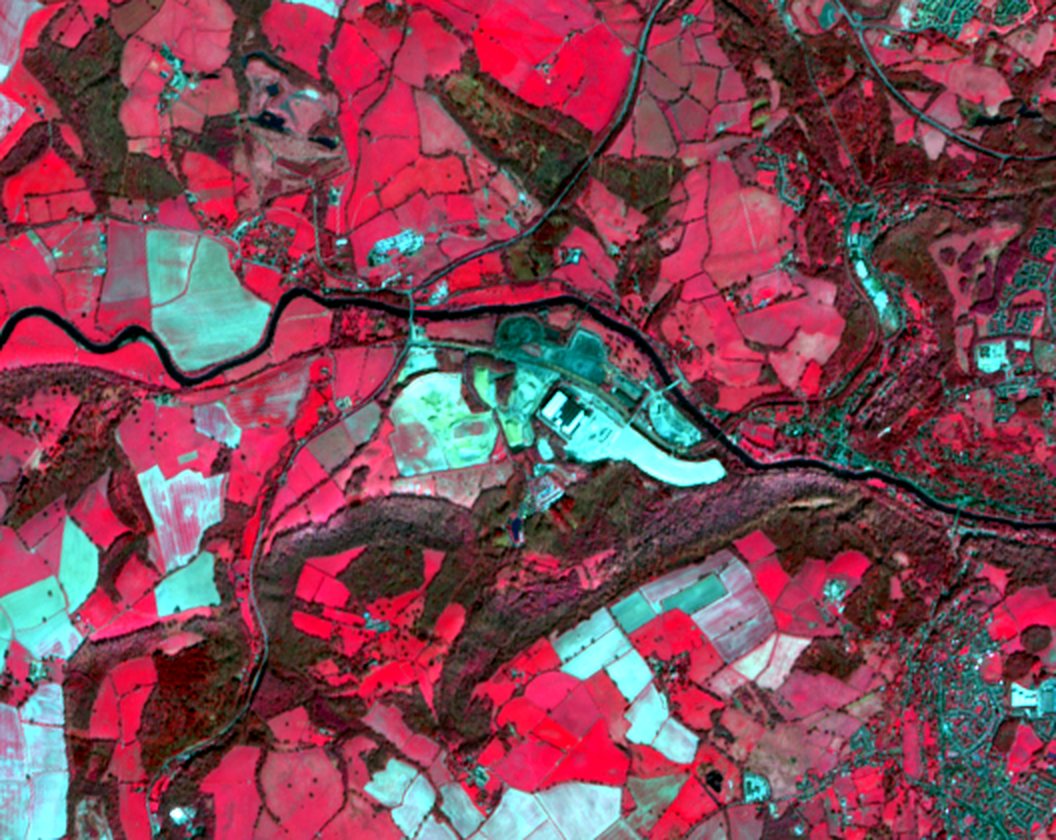
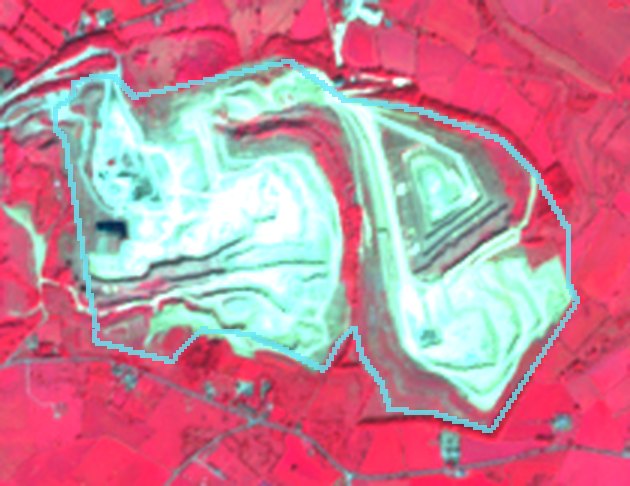
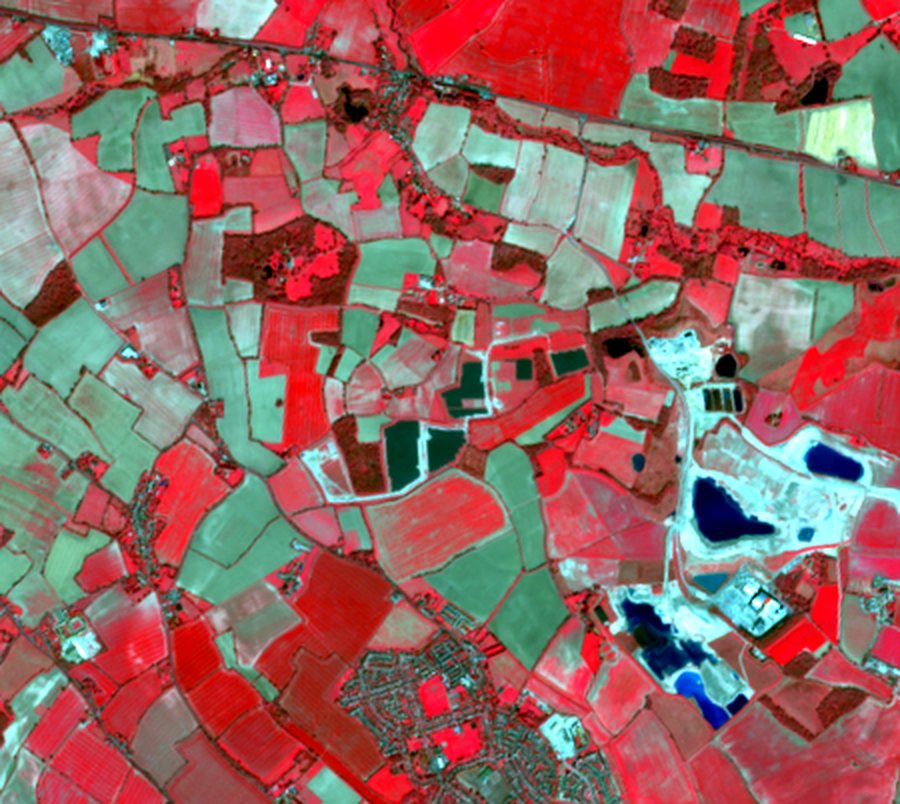
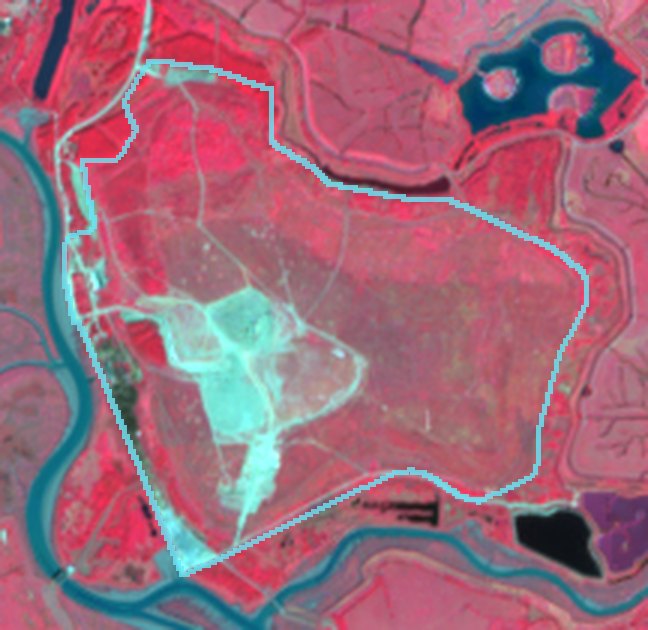
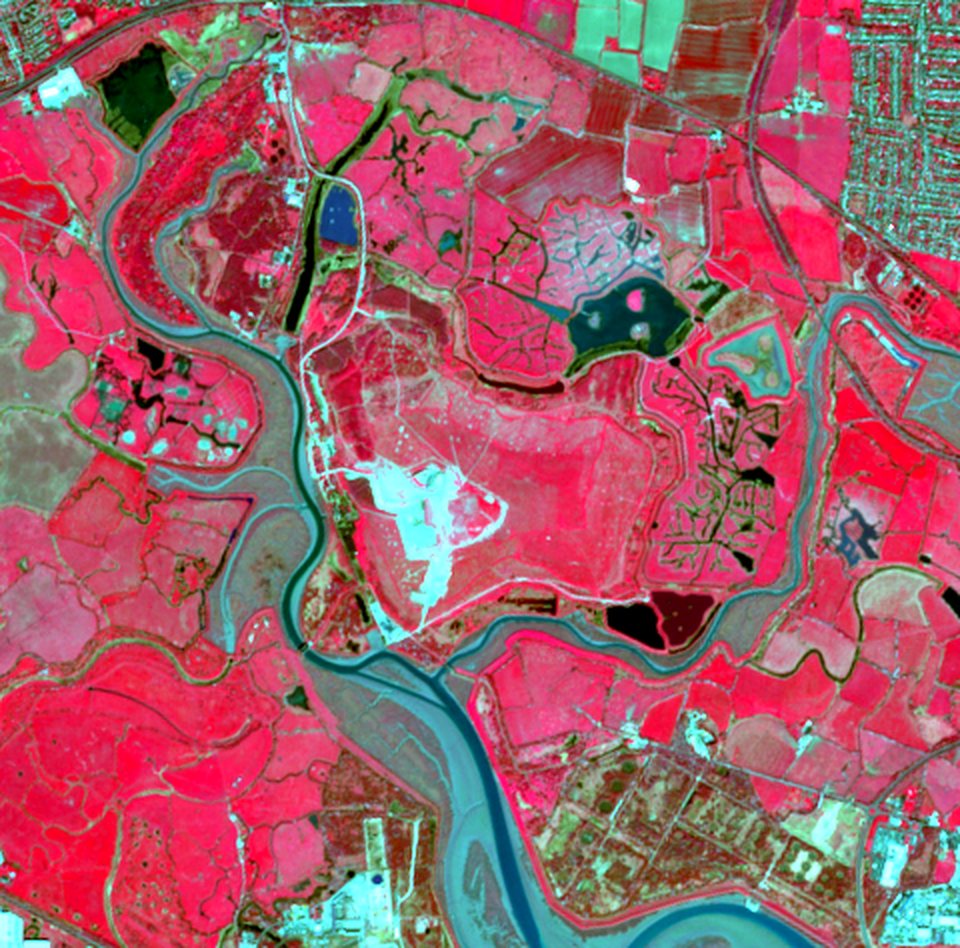
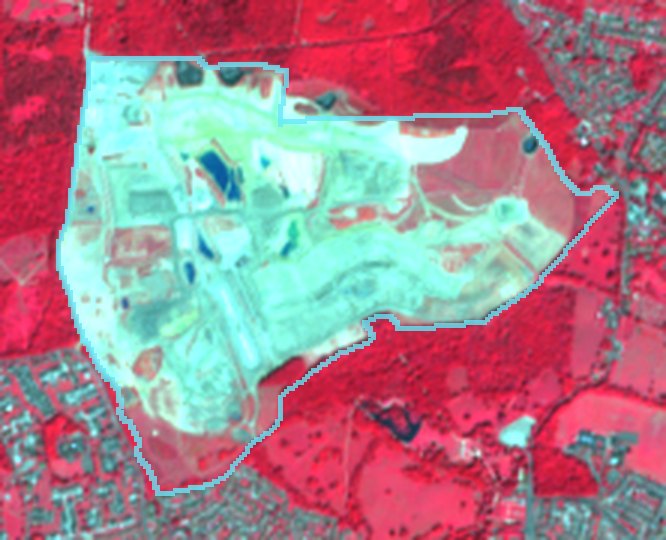
Near-infrared composite

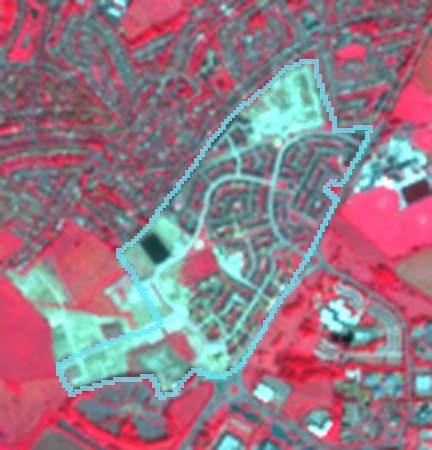
Healthy vegetation appears red; bare ground and buildings cyan-grey.

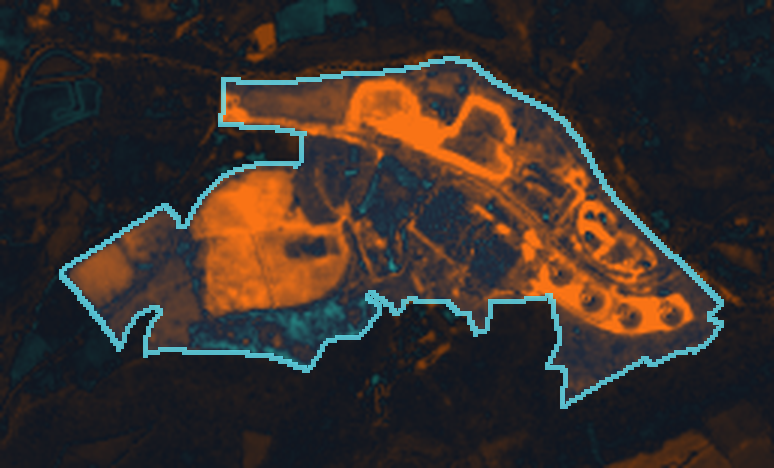
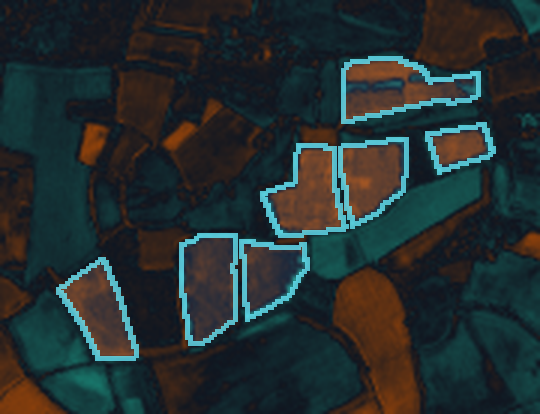
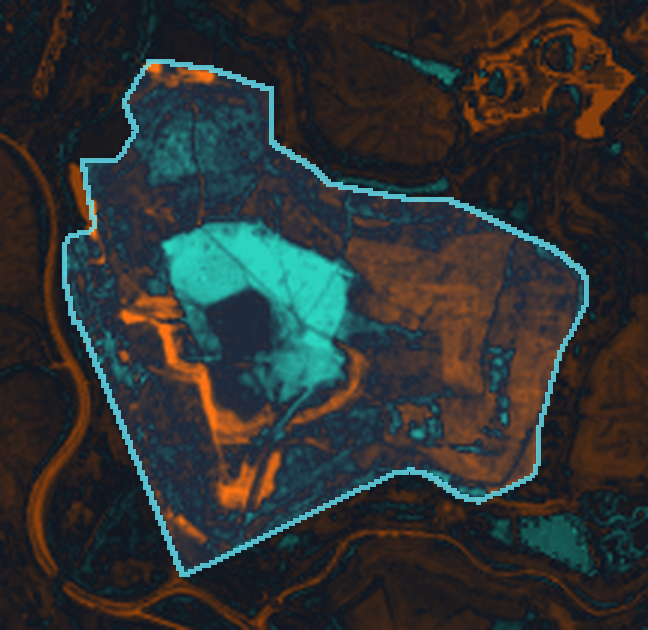
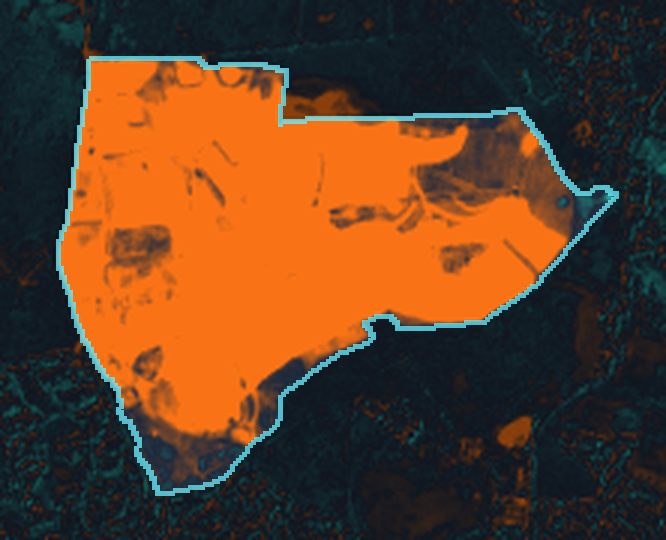
Vegetation-index change

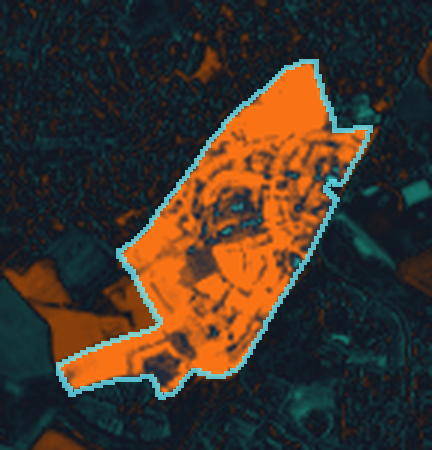
ΔNDVI between periods: orange = loss, teal = gain.

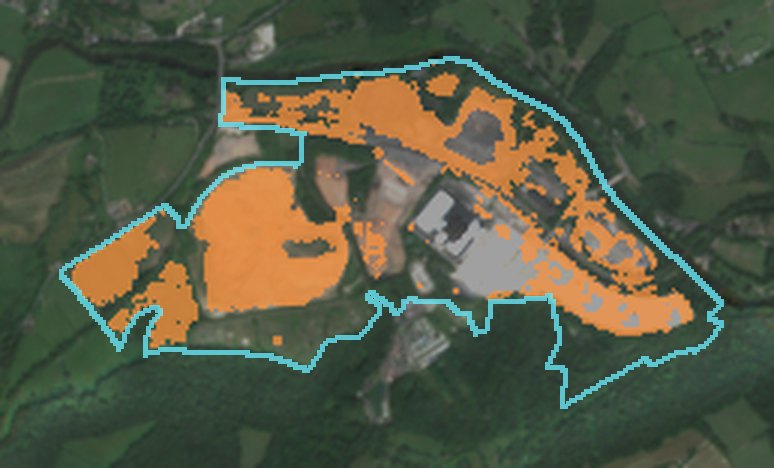
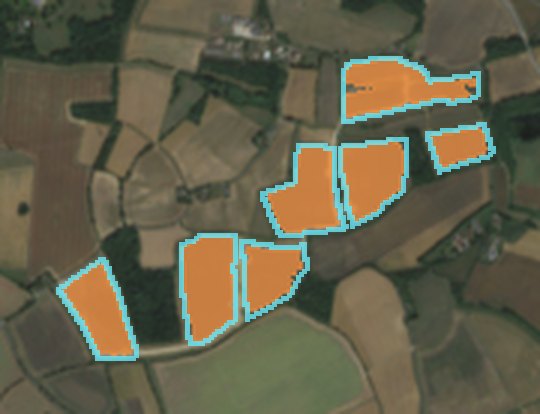
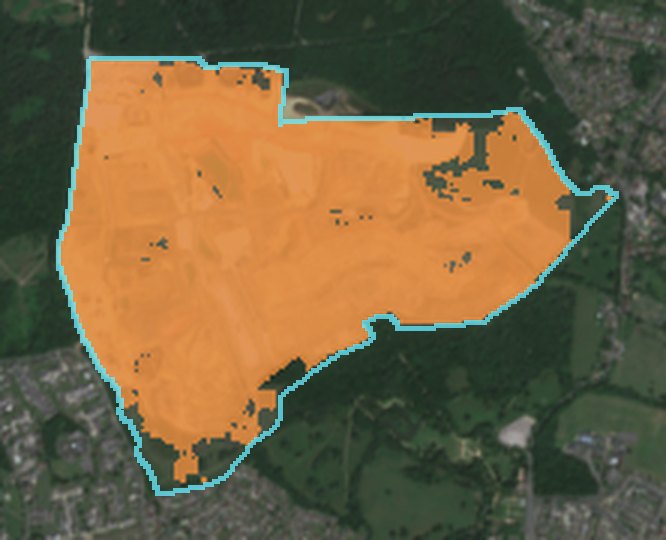
Detected change

Pixels passing the pre-registered rule, highlighted in orange.

Representative analysis of archive satellite imagery — not client work

Reservoir construction earthworks

Water infrastructure South East England

141.3 ha changed

91% of the 155 ha site footprint

Open grassland transformed into a major earthworks site between two summers. Exposed and engineered ground now covers almost the entire footprint.

Baseline periodApr 2018 – Sep 2018
Comparison periodApr 2025 – Sep 2025
Cloud-screened captures5 + 6
Mean ΔNDVI in changed area-0.54
Mean ΔBSI in changed area+0.31
Classificationvegetation loss exposed ground
Method versionchange-v1.2

Interpretation: a site-wide loss of vegetation signal and a strong rise in bare-soil index, spatially coherent across the footprint, consistent with large-scale earthworks for a new reservoir. Residual vegetation remains only at the margins; seasonal effects are excluded by comparing the same months.

Reservoir construction earthworks: natural colour, baseline period
NATURAL COLOUR · Apr 2018 – Sep 2018
Reservoir construction earthworks: natural colour, comparison period
NATURAL COLOUR · Apr 2025 – Sep 2025
Reservoir construction earthworks: near-infrared composite, comparison period
NEAR-INFRARED COMPOSITE
Reservoir construction earthworks: vegetation index change map
ΔNDVI · ORANGE LOSS · TEAL GAIN
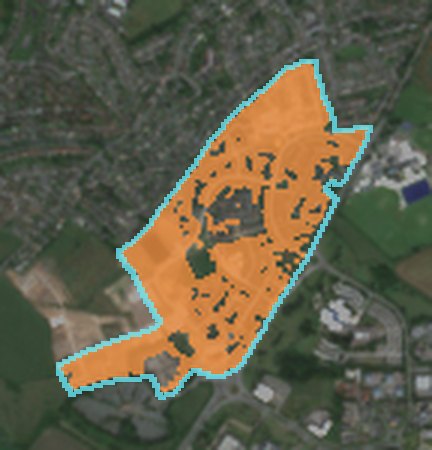
Reservoir construction earthworks: detected change highlighted
DETECTED CHANGE · 141.3 HA
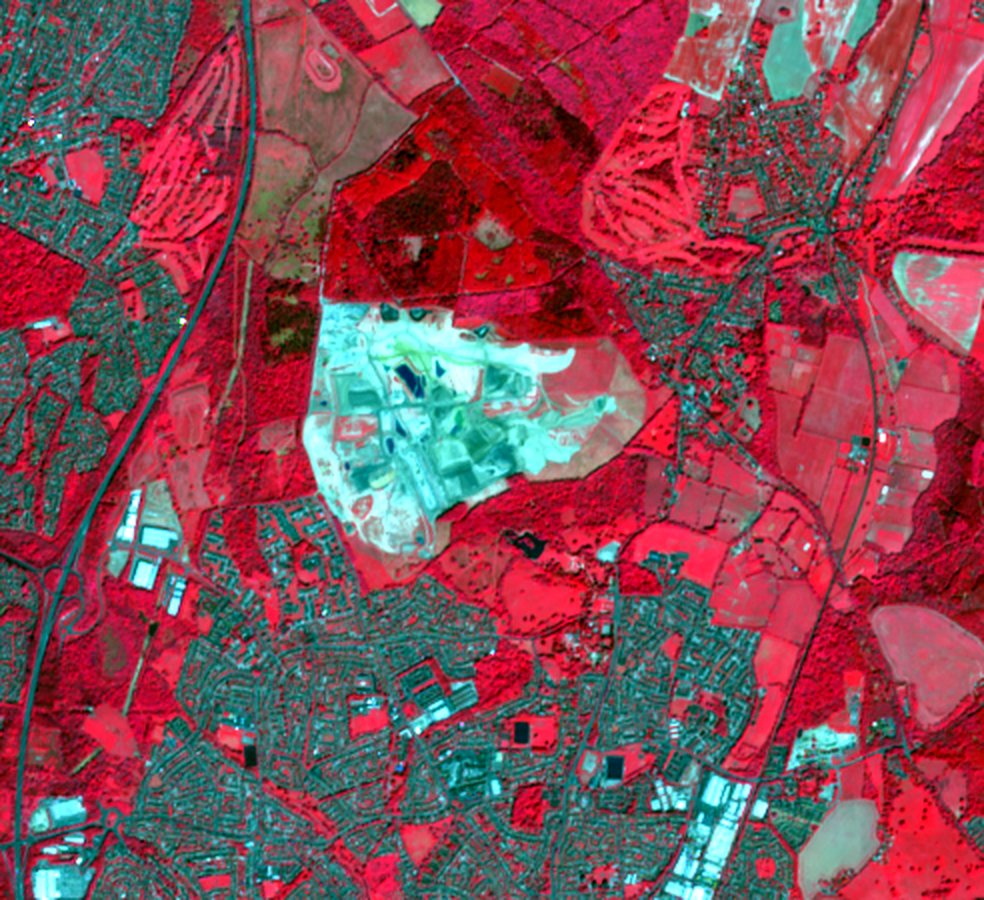
Reservoir construction earthworks: wide-area near-infrared view
WIDE-AREA CONTEXT · NEAR-INFRARED

Cyan line: mapped site outline. Images resampled for display from 10 m pixels; nothing finer than the sensor resolution is implied.
Representative analysis of archive satellite imagery — not client work

New residential neighbourhood

Residential development North West England

39.1 ha changed

79% of the 50 ha site footprint

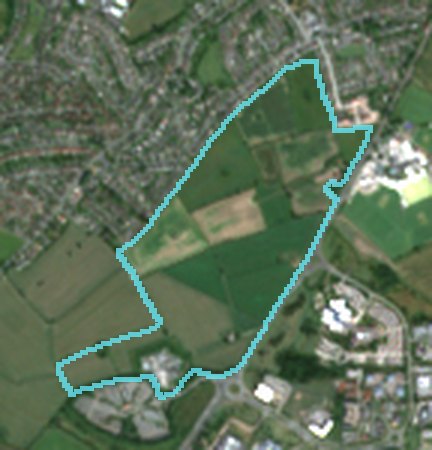
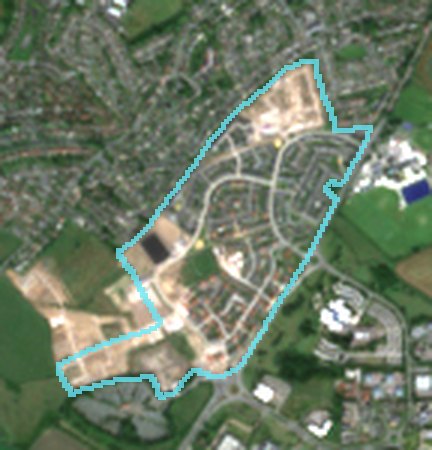
Agricultural fields replaced by a new neighbourhood: a street network, house plots and open areas are visible in the comparison period, with active groundworks continuing at the western edge.

Baseline periodApr 2018 – Sep 2018
Comparison periodApr 2025 – Sep 2025
Cloud-screened captures6 + 6
Mean ΔNDVI in changed area-0.46
Mean ΔBSI in changed area+0.24
Classificationvegetation loss exposed ground
Method versionchange-v1.2

Interpretation: vegetation loss and new built and bare surfaces across most of the footprint, consistent with phased housebuilding. Gardens and landscaping retain some vegetation, so the changed fraction is below the full built area.

New residential neighbourhood: natural colour, baseline period
NATURAL COLOUR · Apr 2018 – Sep 2018
New residential neighbourhood: natural colour, comparison period
NATURAL COLOUR · Apr 2025 – Sep 2025
New residential neighbourhood: near-infrared composite, comparison period
NEAR-INFRARED COMPOSITE
New residential neighbourhood: vegetation index change map
ΔNDVI · ORANGE LOSS · TEAL GAIN
New residential neighbourhood: detected change highlighted
DETECTED CHANGE · 39.1 HA
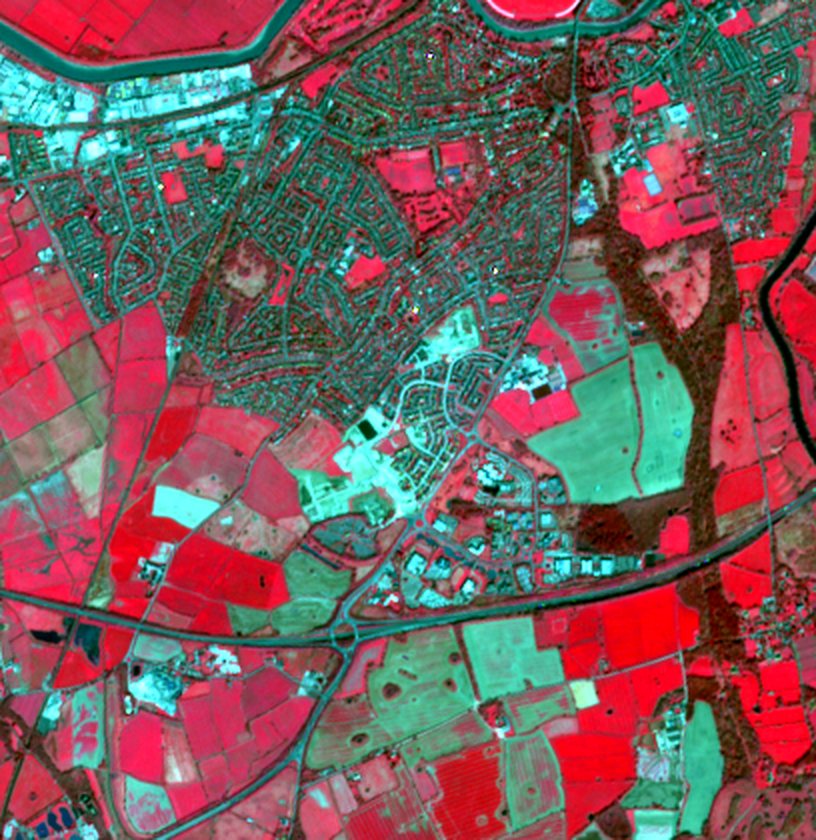
New residential neighbourhood: wide-area near-infrared view
WIDE-AREA CONTEXT · NEAR-INFRARED

Cyan line: mapped site outline. Images resampled for display from 10 m pixels; nothing finer than the sensor resolution is implied.
Representative analysis of archive satellite imagery — not client work

Former power station redevelopment

Brownfield regeneration West Midlands

54.6 ha changed

40% of the 135 ha site footprint

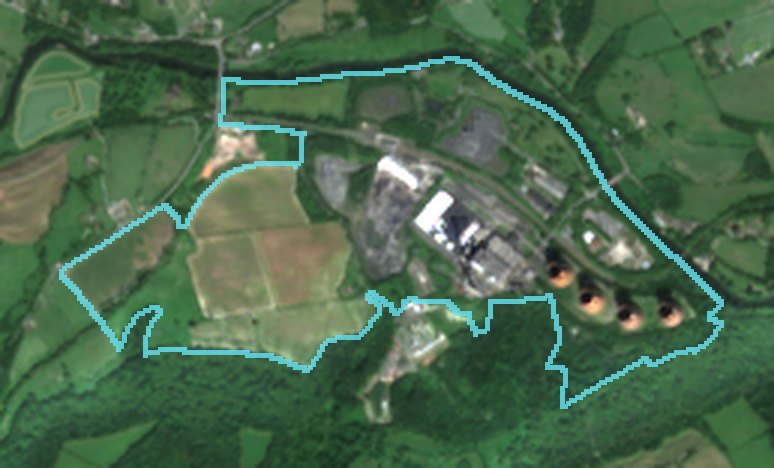
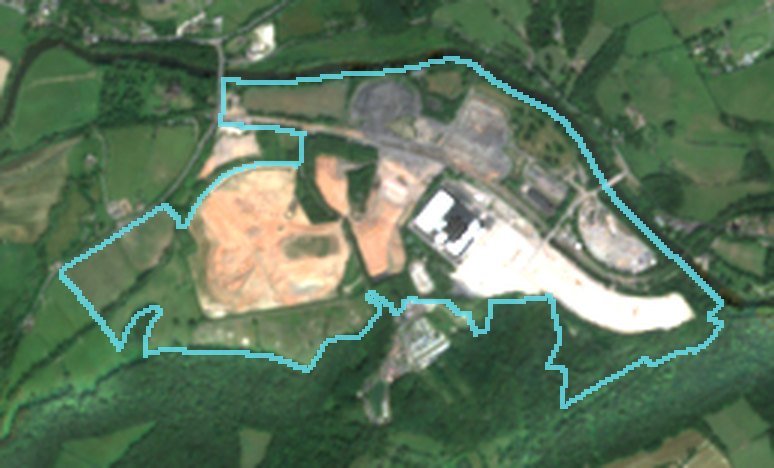
Large circular structures and plant visible in the baseline are no longer present. The former operational area has been cleared to open platforms and exposed ground.

Baseline periodApr 2018 – Sep 2018
Comparison periodApr 2025 – Sep 2025
Cloud-screened captures4 + 6
Mean ΔNDVI in changed area-0.34
Mean ΔBSI in changed area+0.20
Classificationvegetation loss exposed ground
Method versionchange-v1.2

Interpretation: the disappearance of the large structures and the extensive bright, bare surfaces are consistent with demolition and site clearance ahead of redevelopment. Surrounding woodland and the river corridor show no significant change.

Former power station redevelopment: natural colour, baseline period
NATURAL COLOUR · Apr 2018 – Sep 2018
Former power station redevelopment: natural colour, comparison period
NATURAL COLOUR · Apr 2025 – Sep 2025
Former power station redevelopment: near-infrared composite, comparison period
NEAR-INFRARED COMPOSITE
Former power station redevelopment: vegetation index change map
ΔNDVI · ORANGE LOSS · TEAL GAIN
Former power station redevelopment: detected change highlighted
DETECTED CHANGE · 54.6 HA
Former power station redevelopment: wide-area near-infrared view
WIDE-AREA CONTEXT · NEAR-INFRARED

Cyan line: mapped site outline. Images resampled for display from 10 m pixels; nothing finer than the sensor resolution is implied.
Representative analysis of archive satellite imagery — not client work

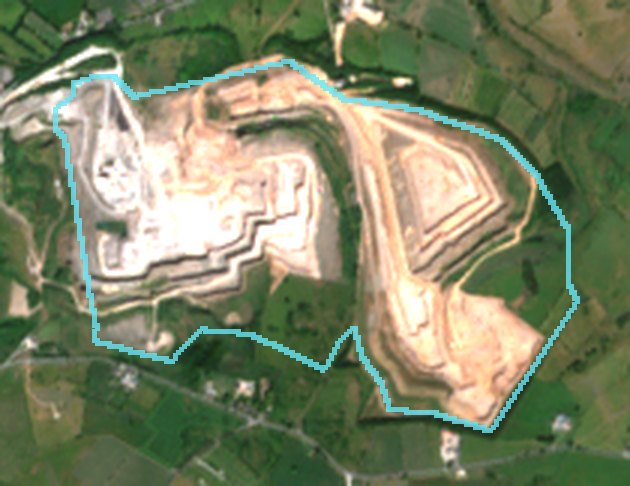
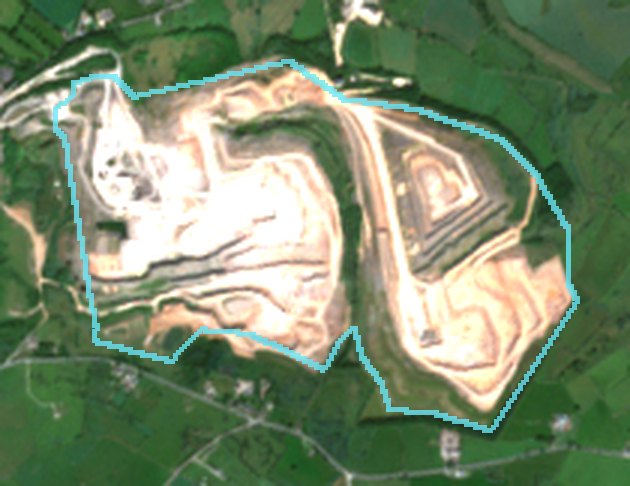
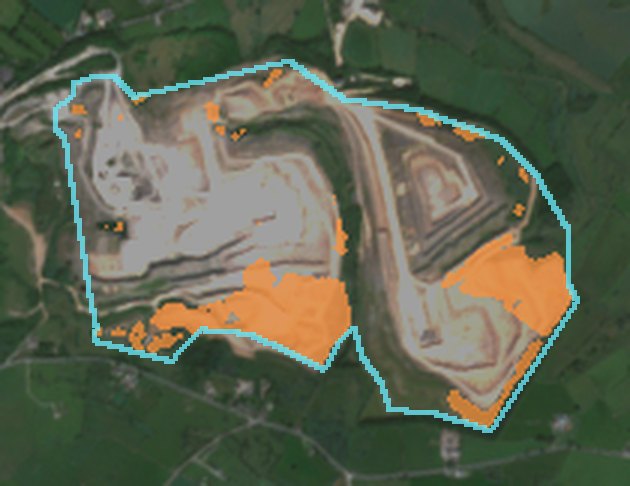
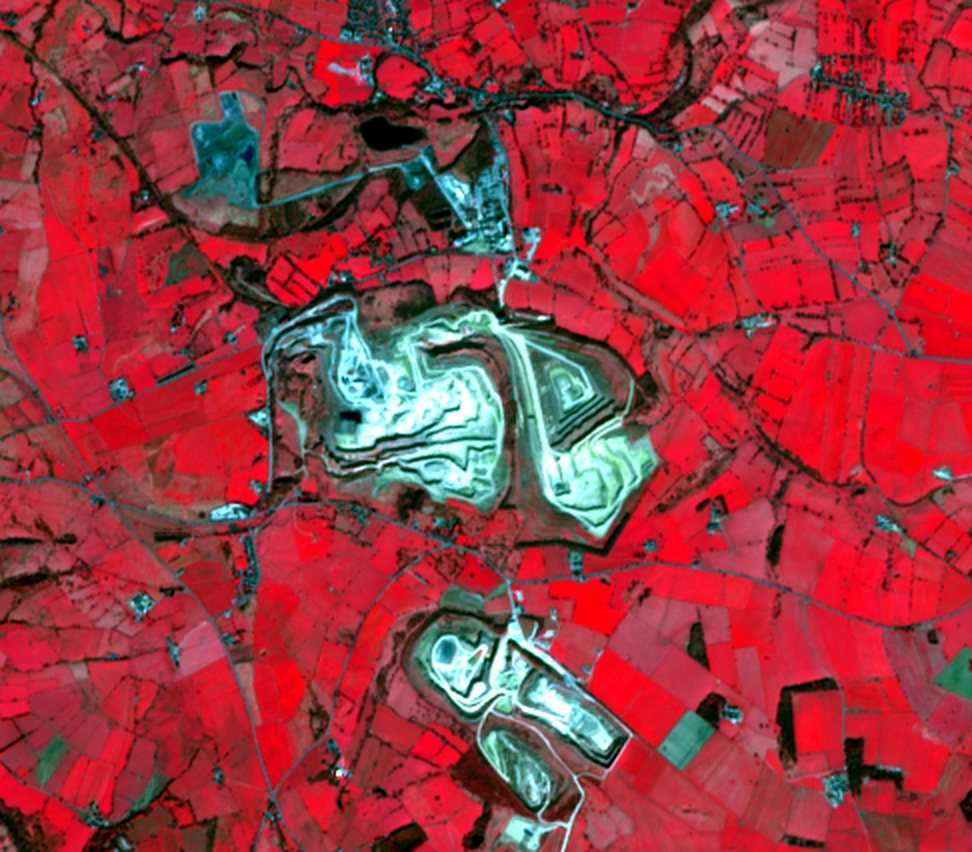
Limestone quarry extension

Mineral extraction Central England

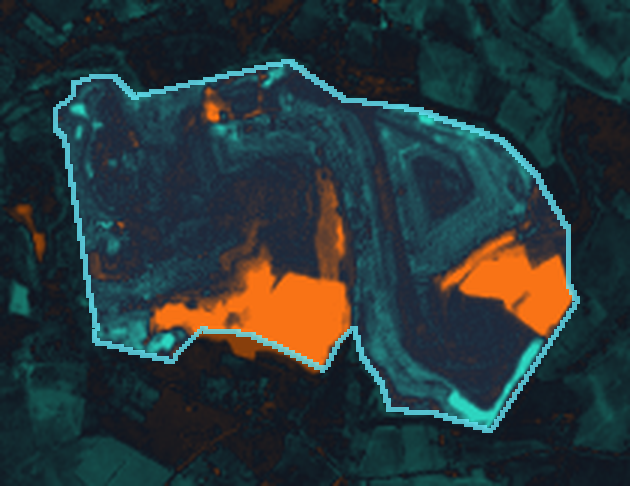
23.8 ha changed

17% of the 143 ha site footprint

Two working areas advanced into adjacent grassland along the southern margins of the quarry, exposing newly worked rock and soil.

Baseline periodApr 2018 – Sep 2018
Comparison periodApr 2025 – Sep 2025
Cloud-screened captures5 + 5
Mean ΔNDVI in changed area-0.39
Mean ΔBSI in changed area+0.23
Classificationvegetation loss exposed ground
Method versionchange-v1.2

Interpretation: vegetation loss and bright exposed surfaces concentrated at the quarry margins are consistent with extension of the working area. Established faces show little change; stockpile and haul-road movements contribute small additional areas.

Limestone quarry extension: natural colour, baseline period
NATURAL COLOUR · Apr 2018 – Sep 2018
Limestone quarry extension: natural colour, comparison period
NATURAL COLOUR · Apr 2025 – Sep 2025
Limestone quarry extension: near-infrared composite, comparison period
NEAR-INFRARED COMPOSITE
Limestone quarry extension: vegetation index change map
ΔNDVI · ORANGE LOSS · TEAL GAIN
Limestone quarry extension: detected change highlighted
DETECTED CHANGE · 23.8 HA
Limestone quarry extension: wide-area near-infrared view
WIDE-AREA CONTEXT · NEAR-INFRARED

Cyan line: mapped site outline. Images resampled for display from 10 m pixels; nothing finer than the sensor resolution is implied.
Representative analysis of archive satellite imagery — not client work

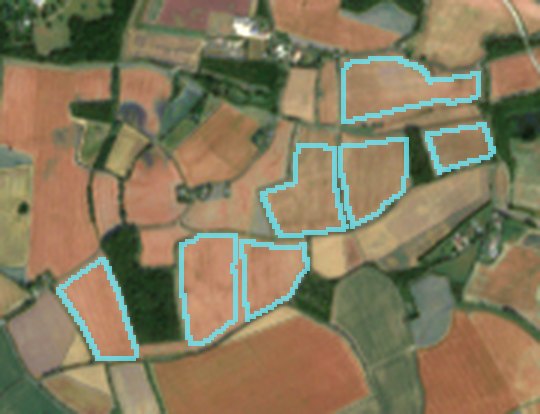
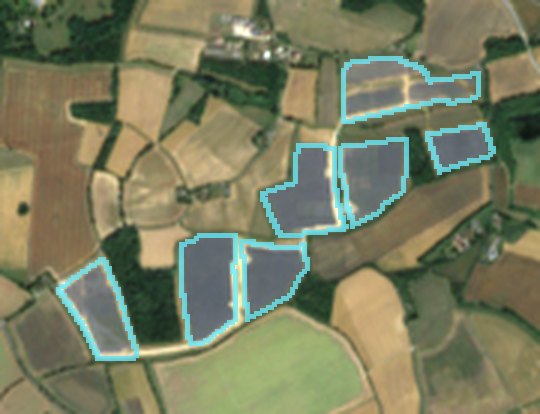
Utility-scale solar build

Energy infrastructure East of England

29.2 ha changed

90% of the 32 ha site footprint

A greenfield agricultural site converted to a ground-mounted solar array between two summers. The change footprint matches the array layout and covers nearly the whole site.

Baseline periodApr 2022 – Sep 2022
Comparison periodApr 2025 – Sep 2025
Cloud-screened captures5 + 6
Mean ΔNDVI in changed area-0.10
Mean ΔBSI in changed area+0.33
Classificationvegetation loss exposed ground
Method versionchange-v1.2

Interpretation: loss of vegetation signal and exposed or engineered surfaces consistent with the construction of a ground-mounted solar array recorded in a public register for this site. Alternative explanations (harvest, ploughing) are excluded by the seasonal matching and the spatial pattern.

Utility-scale solar build: natural colour, baseline period
NATURAL COLOUR · Apr 2022 – Sep 2022
Utility-scale solar build: natural colour, comparison period
NATURAL COLOUR · Apr 2025 – Sep 2025
Utility-scale solar build: near-infrared composite, comparison period
NEAR-INFRARED COMPOSITE
Utility-scale solar build: vegetation index change map
ΔNDVI · ORANGE LOSS · TEAL GAIN
Utility-scale solar build: detected change highlighted
DETECTED CHANGE · 29.2 HA
Utility-scale solar build: wide-area near-infrared view
WIDE-AREA CONTEXT · NEAR-INFRARED

Cyan line: mapped site outline. Images resampled for display from 10 m pixels; nothing finer than the sensor resolution is implied.
Representative analysis of archive satellite imagery — not client work

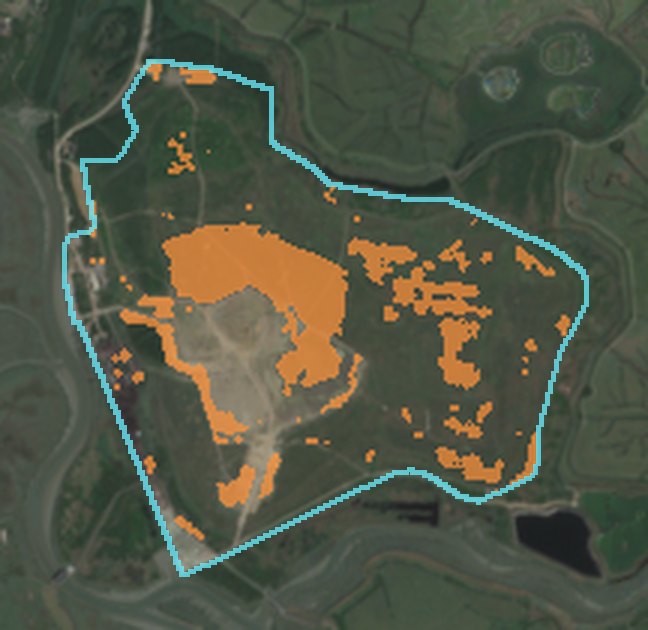
Landfill capping and restoration

Waste & restoration Thames Estuary

35.7 ha changed

20% of the 180 ha site footprint

Previously bare, capped ground at the centre of the site has revegetated, while smaller working areas opened at the margins: change in both directions across the footprint.

Baseline periodApr 2018 – Sep 2018
Comparison periodApr 2025 – Sep 2025
Cloud-screened captures6 + 6
Mean ΔNDVI in changed area+0.07
Mean ΔBSI in changed area+0.06
Classificationmixed change
Method versionchange-v1.2

Interpretation: vegetation gain over the central capped area (teal in the index map) is consistent with restoration; smaller losses at the edges indicate continuing operational works. The site-level result is therefore classified as mixed change.

Landfill capping and restoration: natural colour, baseline period
NATURAL COLOUR · Apr 2018 – Sep 2018
Landfill capping and restoration: natural colour, comparison period
NATURAL COLOUR · Apr 2025 – Sep 2025
Landfill capping and restoration: near-infrared composite, comparison period
NEAR-INFRARED COMPOSITE
Landfill capping and restoration: vegetation index change map
ΔNDVI · ORANGE LOSS · TEAL GAIN
Landfill capping and restoration: detected change highlighted
DETECTED CHANGE · 35.7 HA
Landfill capping and restoration: wide-area near-infrared view
WIDE-AREA CONTEXT · NEAR-INFRARED

Cyan line: mapped site outline. Images resampled for display from 10 m pixels; nothing finer than the sensor resolution is implied.
Full report format

Sample report

The complete deliverable for one representative site: every capture used, measurements, the decision rule, observed facts and interpretation kept separate, and limitations.

Open the sample report